Code
library(tidyverse)
library(tidymodels)
library(factoextra)

data(iris)
iris_data <- iris %>% select(-Species)Using tidymodels
This document demonstrates how to perform clustering in R using the tidymodels framework. Clustering is an unsupervised learning technique that groups similar data points together based on their inherent characteristics. We will use the iris dataset for this demonstration.
First, we load the necessary libraries and the iris dataset.
library(tidyverse)
library(tidymodels)
library(factoextra)
data(iris)
iris_data <- iris %>% select(-Species)The Elbow Method is a heuristic used to determine the optimal number of clusters in a dataset. We can visualize the total within-cluster sum of squares as a function of the number of clusters. 3 looks like a good number.
fviz_nbclust(iris_data, kmeans, method = "wss") +
  labs(subtitle = "Elbow Method")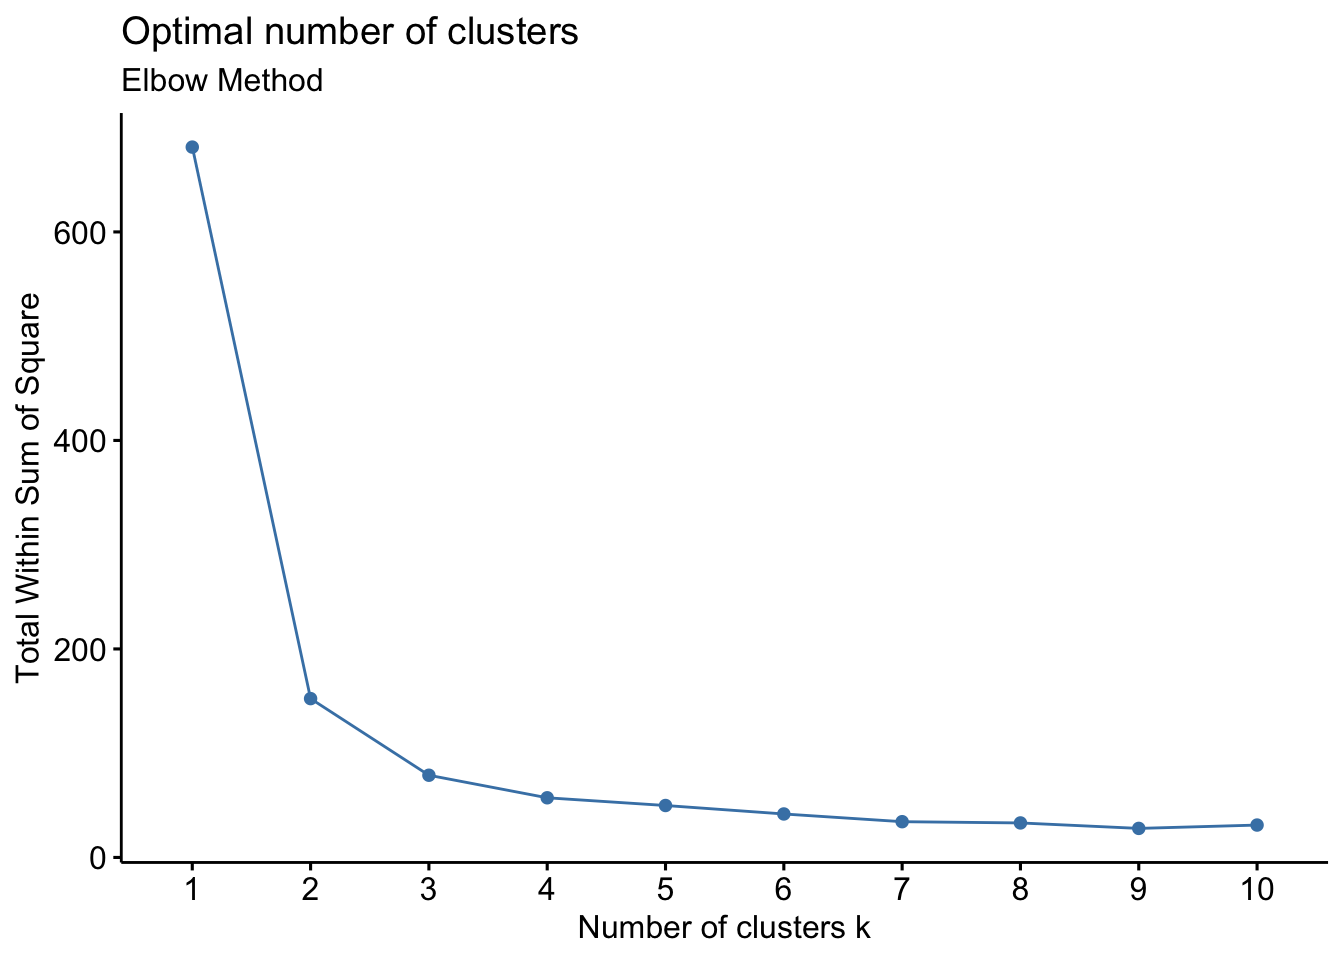
K-Means is a popular clustering algorithm. We will use it to group the iris data into 3 clusters.
set.seed(123)
kmeans_model <- kmeans(iris_data, centers = 3, nstart = 25)

# Visualize the clusters
fviz_cluster(kmeans_model, data = iris_data)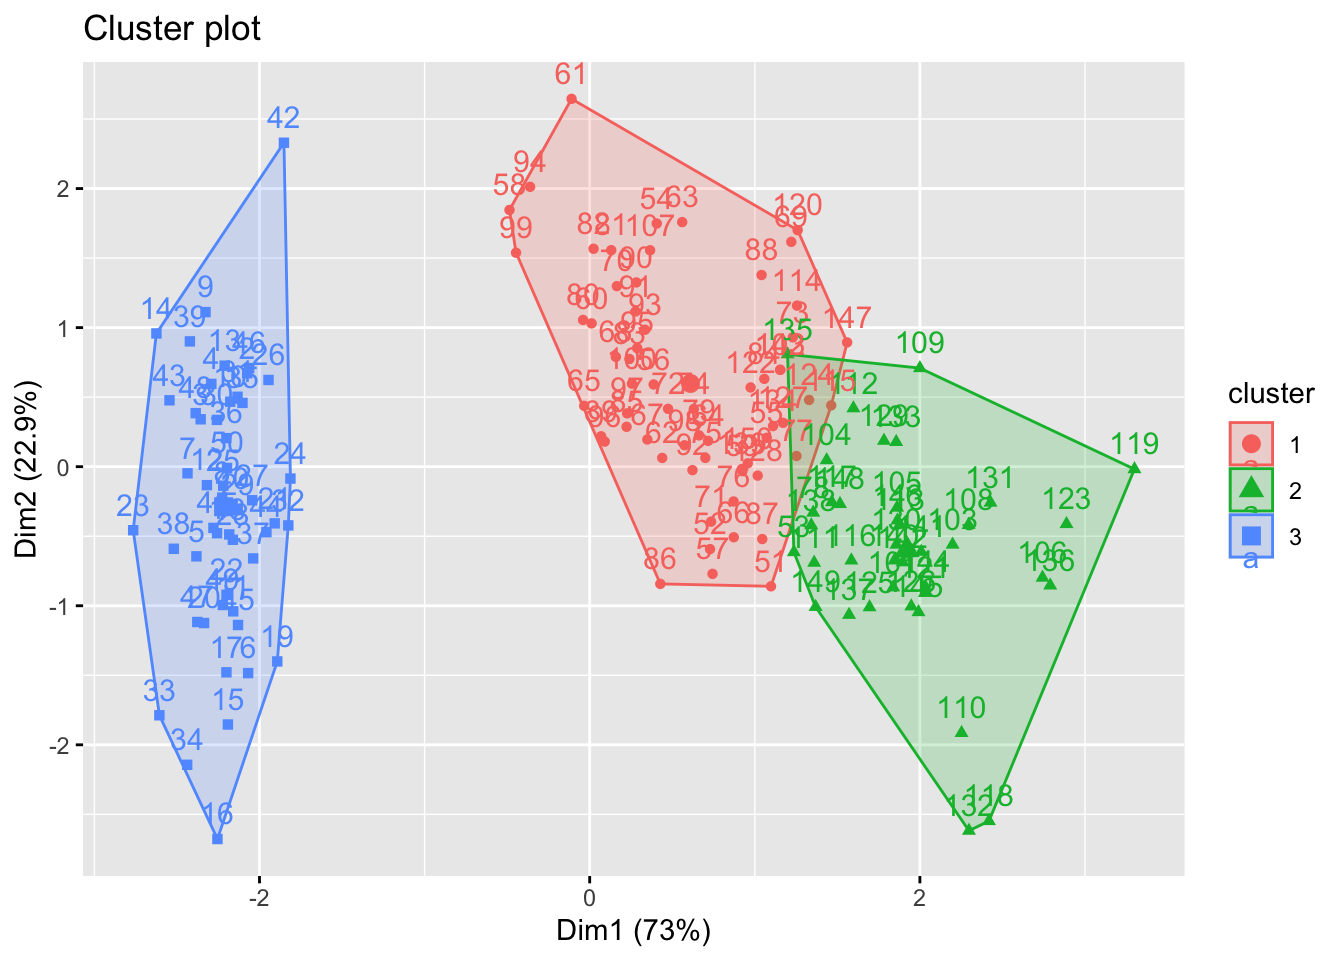
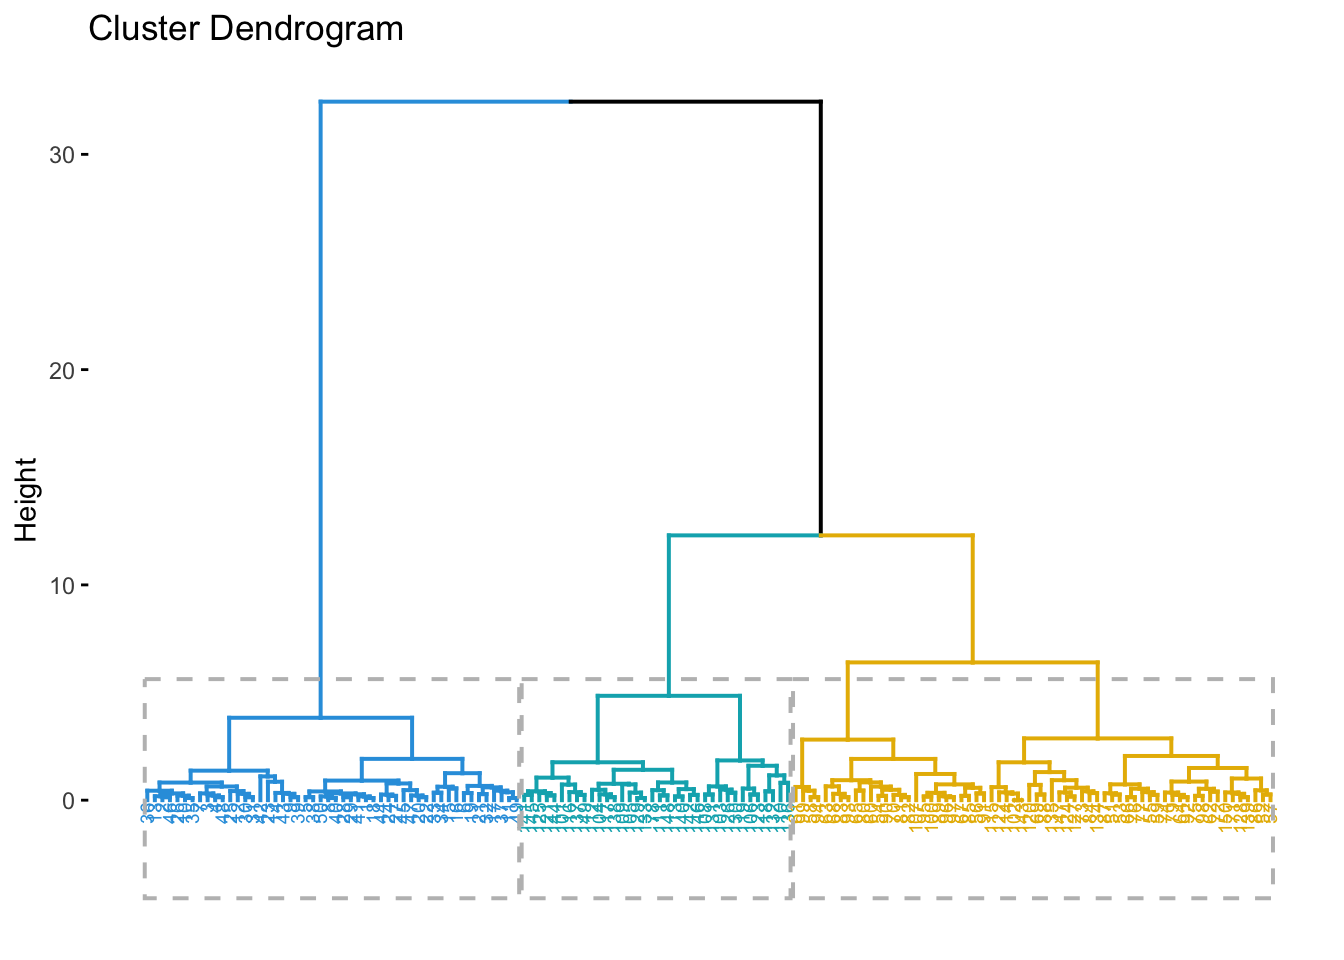
Hierarchical clustering is another common clustering method.
# Calculate the distance matrix
dist_matrix <- dist(iris_data, method = "euclidean")

# Perform hierarchical clustering
hclust_model <- hclust(dist_matrix, method = "ward.D2")

# Visualize the dendrogram
fviz_dend(hclust_model, k = 3, # Cut in 3 groups
          cex = 0.5, # label size
          k_colors = c("#2E9FDF", "#00AFBB", "#E7B800"),
          color_labels_by_k = TRUE, # color labels by groups
          rect = TRUE # Add rectangle around groups
          )
We can compare the clustering results with the actual species of the iris flowers.
# K-Means Comparison
iris$kmeans_cluster <- kmeans_model$cluster
print("K-Means Clustering vs. Real Species")
[1] "K-Means Clustering vs. Real Species"table(iris$kmeans_cluster, iris$Species)
    setosa versicolor virginica
  1      0         48        14
  2      0          2        36
3 50 0 0# Hierarchical Clustering Comparison
iris$hclust_cluster <- cutree(hclust_model, k = 3)
print("Hierarchical Clustering vs. Real Species")[1] "Hierarchical Clustering vs. Real Species"table(iris$hclust_cluster, iris$Species)
    setosa versicolor virginica
  1     50          0         0
  2      0         49        15
3 0 1 35Here’s a comparison of K-Means and Hierarchical Clustering:
| Feature | K-Means Clustering | Hierarchical Clustering |
|---|---|---|
| Approach | Partitioning (divides data into k clusters) | Agglomerative (bottom-up) or Divisive (top-down) |
| Number of Clusters | Requires pre-specification (k) | Does not require pre-specification; dendrogram helps |
| Computational Cost | Faster for large datasets | Slower for large datasets (O(n^3) or O(n^2)) |
| Cluster Shape | Tends to form spherical clusters | Can discover arbitrarily shaped clusters |
| Sensitivity to Outliers | Sensitive to outliers | Less sensitive to outliers |
| Interpretability | Easy to interpret | Dendrogram can be complex for large datasets |
| Reproducibility | Can vary with initial centroids (unless fixed) | Reproducible |
This document provided a brief overview of clustering in R using tidymodels. We demonstrated both K-Means and Hierarchical clustering on the iris dataset.